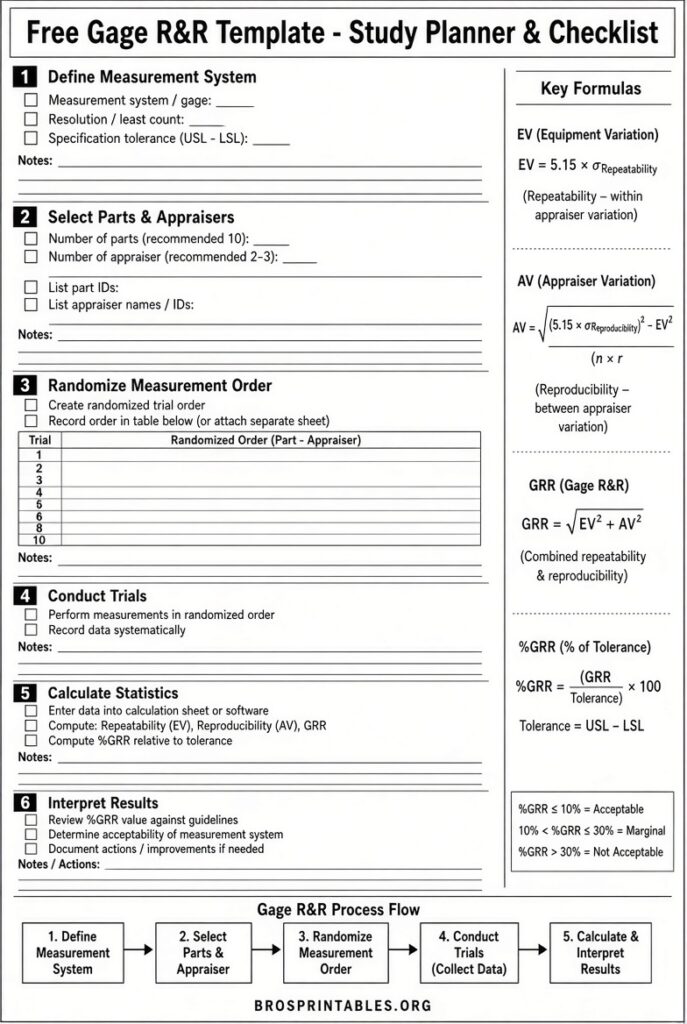
Free Gage Rr Template – A free Gage R&R template (also called Gauge R&R or Gage Repeatability and Reproducibility template) helps quality teams, process engineers, and Six Sigma practitioners in the United States evaluate measurement systems quickly and consistently. These templates support the AIAG MSA (Measurement Systems Analysis) approach commonly required for PPAP, IATF 16949, and internal quality systems.
This resource page explains what a Gage R&R study is, how to use a free template, and where to obtain legitimate free Excel and printable versions without paying for software.
What Is a Gage R&R Template?
A Gage R&R study quantifies how much of the observed variation comes from the measurement system itself versus the parts being measured.
- Repeatability (Equipment Variation or EV) – Variation when the same operator measures the same part multiple times with the same gage.
- Reproducibility (Appraiser Variation or AV) – Variation between different operators measuring the same parts.
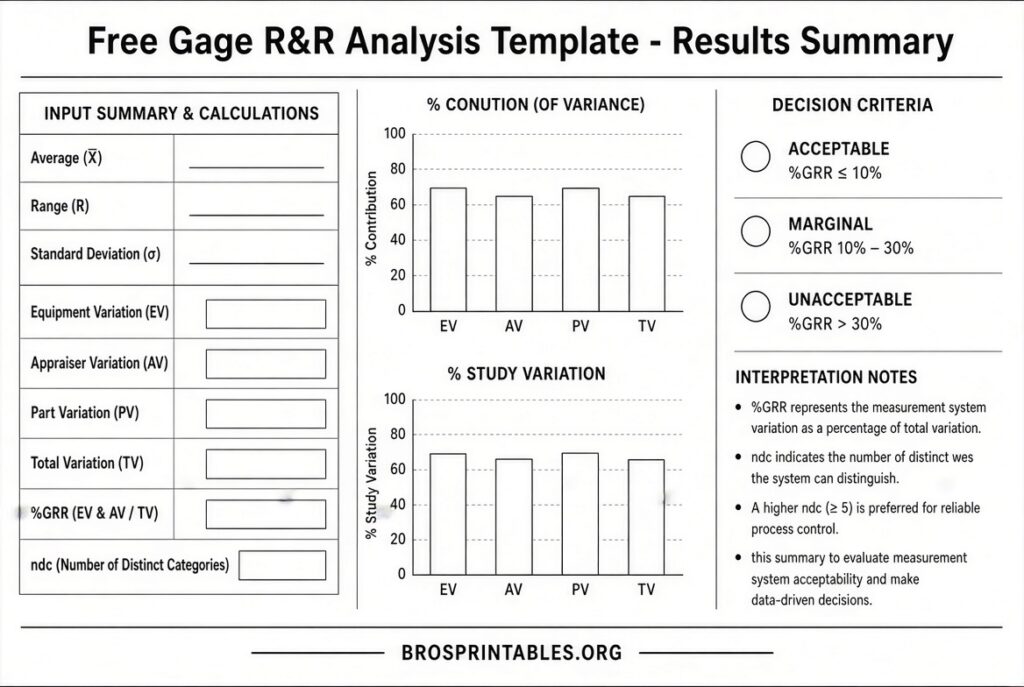
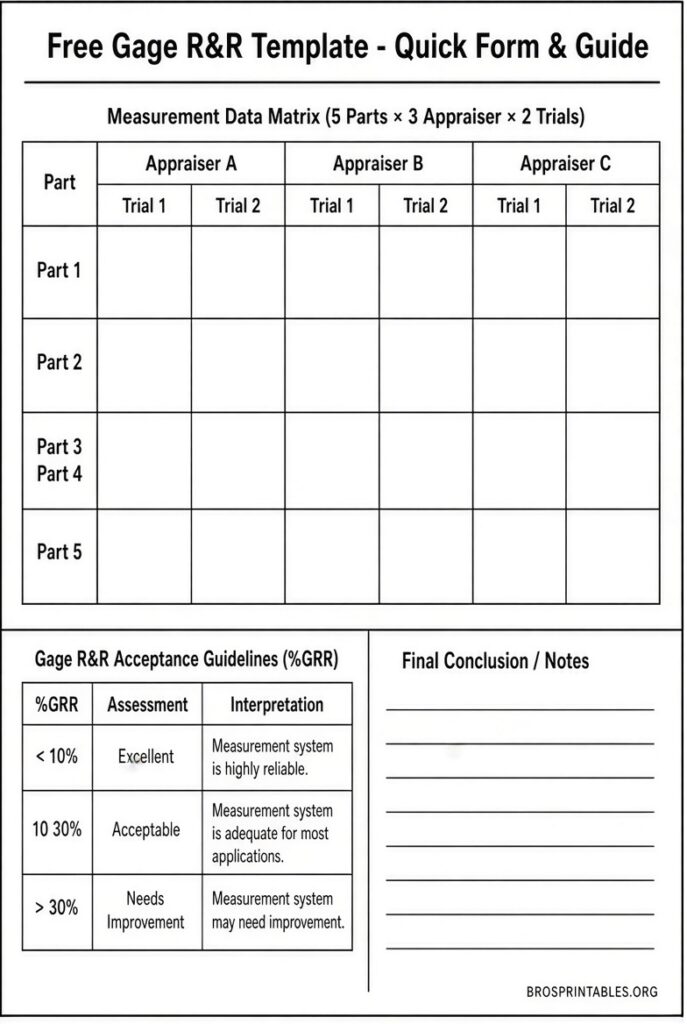
Together these form the total Gage R&R (GRR). Results are usually expressed as a percentage of total variation or of tolerance. Common AIAG guidelines used across U.S. manufacturing are:
- Under 10% – Generally acceptable
- 10–30% – May be acceptable depending on the application and cost of improvement
- Over 30% – Unacceptable; the measurement system needs improvement
The number of distinct categories (ndc) should typically be 5 or higher. A well-designed free Gage R&R template automates the average-and-range or ANOVA calculations so you can focus on data collection and interpretation.
Why Use a Free Gage R&R Template?
Many U.S. plants still rely on Excel rather than specialized statistical software for routine MSA work. A good free template provides:
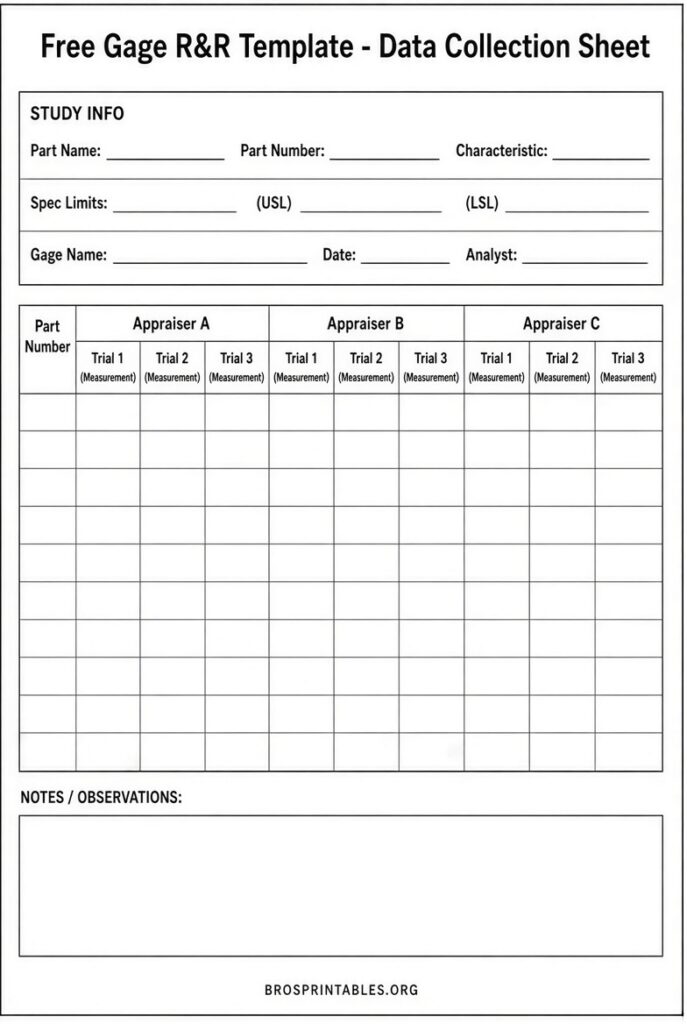
- Pre-formatted data entry for the standard study design (commonly 10 parts × 2–3 operators × 2–3 trials)
- Automatic calculation of EV, AV, GRR, part variation (PV), total variation (TV), %GRR, and ndc
- Clear acceptance guidance aligned with AIAG MSA practices
- Printable PDF versions for shop-floor data collection or audit records
Using a verified free template reduces calculation errors and speeds up studies required before capability analysis, control charting, or customer submissions.
How to Run a Basic Gage R&R Study?
- Select 10 parts that represent the full range of process variation (not just nominal parts).
- Choose 2 or 3 operators who normally use the gage.
- Have each operator measure every part 2 or 3 times in random order, blinded to previous results.
- Enter the data into the template.
- Review %GRR, the EV/AV split, and ndc.
- Act on the results—train operators if AV is high, or improve/fixture the gage if EV is high.
Randomization and blinding are essential. Avoid using parts that are too similar; otherwise %GRR can look artificially poor.
Free Gage Rr Template
Where to Get Legitimate Free Gage R&R Templates?
Here are reliable, currently available free resources. Always verify the download page and avoid sites that require payment or unclear terms.
- LeanSuite offers a free Excel workbook and a printable PDF (letter, landscape) based on the AIAG average-and-range method for 10 parts and 2–3 appraisers/trials. It includes calculations for EV, AV, GRR, %GRR, ndc, and an optional % of tolerance, plus a worked example. Enter a name and work email once to download: LeanSuite Gage R&R Study Sheet.
- Kaizumi provides a free browser-based Gage R&R calculator (no sign-up) that uses the AIAG average-and-range method and also offers a free downloadable Excel template with automatic EV, AV, PV, %GRR, and ndc calculations: Kaizumi Free Gage R&R Calculator & Template.
- Econoshift supplies a free Excel template that uses the ANOVA method, with clear instructions and automatic results interpretation: Econoshift Gage R&R ANOVA Template (direct file link available on the page).
These sources provide transparent, usable free files. Commercial add-ins and paid templates exist if you need advanced features, charts, or multi-study management, but the free options above cover the majority of routine U.S. manufacturing needs.
Tips for Best Results with Any Free Template
- Match the template’s design (number of parts, operators, trials) to your study or adjust carefully.
- Record the gage identification, characteristic, specification, and tolerance on the form.
- Flag and investigate any range that exceeds the calculated control limit before finalizing results.
- Report whether %GRR is relative to total variation or to tolerance—both are useful but answer different questions.
- Keep the completed study with your quality records for audits or customer requests.
Print the PDF data sheet for the shop floor, then transfer readings into the Excel version for automatic calculations.
Brief FAQ
Is a free Gage R&R template accurate enough for audits?
Yes, when it follows the AIAG average-and-range or ANOVA methods and you collect data correctly. Many plants successfully use well-built free Excel templates for internal MSA and supplier submissions.
Excel or PDF—which should I use?
Use the PDF for data collection on the floor. Use the Excel version for calculations, %GRR, ndc, and record-keeping.
Can I modify a free template?
Most free templates allow editing for your company name, logo, or slight layout changes. Do not alter the core calculation formulas unless you fully understand the statistics.
What if my %GRR is between 10% and 30%?
It may still be acceptable depending on the characteristic’s importance, risk, and the cost of improving the gage. Document the decision and any customer agreement.
A reliable free Gage R&R template removes barriers to performing measurement system analysis and helps ensure that process decisions rest on trustworthy data. Start with one of the linked resources above, run a study on a critical characteristic, and build the habit of validating your gages before relying on the numbers they produce.